
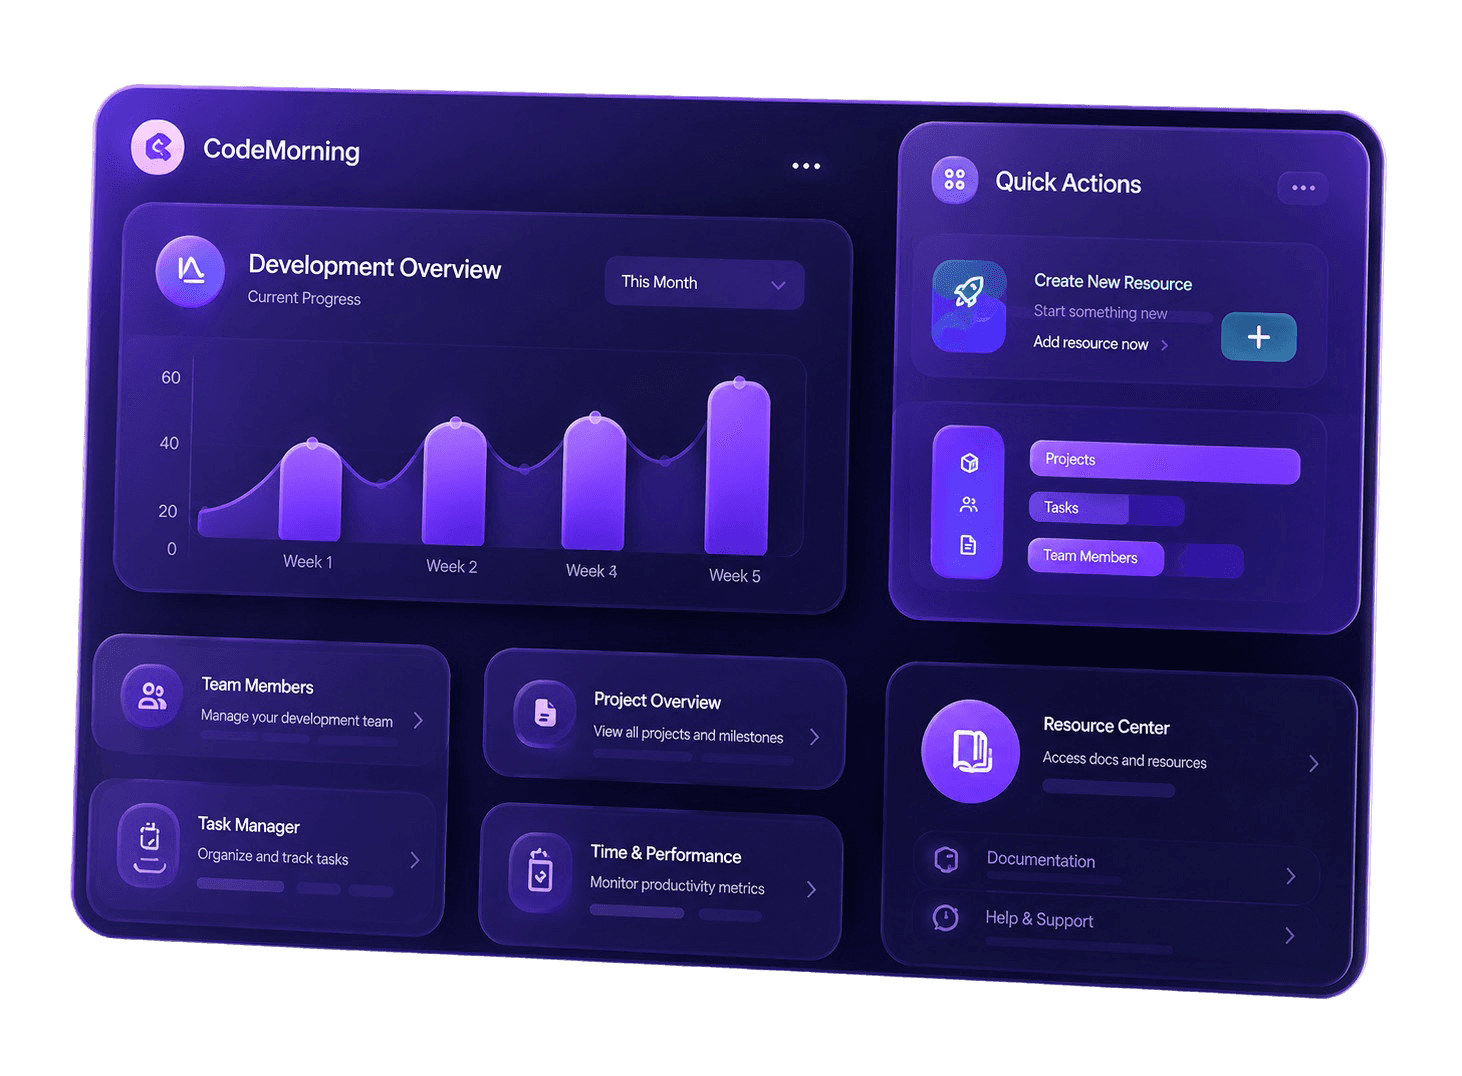
Most dashboards fail for one reason: they show everything and highlight nothing. A useful dashboard answers one question clearly — then helps you decide what to do next.
Start with the decision, not the data
Before you add a chart, ask: what decision does this support? If a metric doesn't change how someone acts in the next week, it probably doesn't belong on the main view.
Track fewer metrics, more consistently
- Leading indicators: Signals that predict future results (pipeline value, activation rate).
- Lagging indicators: Outcomes you care about (revenue, churn, delivery time).
- Operational health: Whether the team can keep up (backlog size, response time).
Design for action
Use thresholds, trends, and comparisons — not just raw numbers. Green, amber, and red states help busy founders scan a screen in seconds.
“A good dashboard tells you what to do. A bad one just shows you everything.”
Need a dashboard built around your KPIs?
We design and build real-time dashboards tied to how your business actually runs.
Explore dashboard services